-
几张图片并列
1
2
3
4
5
6
7
8
9
10
11
12
13
14
15
16
17
18
19
20
21
22
23
24\begin{figure*}[htbp]
\centering
\begin{minipage}[t]{0.35\textwidth}
\parbox[][4cm][t]{\linewidth}{
\centering
\includegraphics[width=\linewidth]{img/1.jpeg}
}
\vspace{1.1cm}
\caption{This is Figure1.}
\label{Fig:r1}
\end{minipage}
\begin{minipage}[t]{0.4\textwidth}
\parbox[][4cm][t]{\linewidth}{
\centering
\includegraphics[width=\linewidth]{img/2.jpeg}
}
\vspace{1.1cm}
\caption{This is Figure2.}
\label{Fig:r2}
\end{minipage}
\end{figure*}![]()
-
竖排图片的间隔问题
1
\vspace{长度}:在当前行下面插入指定长度的竖直间隔
-
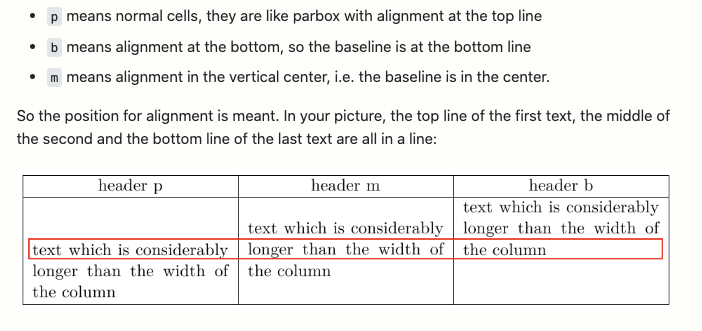
表格垂直居中
1
2
3
4
5
6
7
8
9
10
11
12\begin{tabular}{|p{0.3\linewidth}|m{0.3\linewidth}|b{0.3\linewidth}|}
\hline
\centering header p &
\centering header m &
\centering header b \tabularnewline
\hline
text which is considerably longer than the width of the column &
text which is considerably longer than the width of the column &
text which is considerably longer than the width of the column
\tabularnewline
\hline
\end{tabular}只需设置一行为 m,即可让其他行都居中
![]()
-
表格在文中的位置
1
\begin{table}[htb]
h - here 即表格在文中位置
t - top
b - bottom
[htb] 按照顺序排列进行选择
其中 h 表示 here, t –top, b-bottom,即表格在文中的位置。那么 [htb] 是按照其顺序排列进行选择,即 h, t ,b 顺序。
-
bib 引用注释
1
2
3
4
5
6
7
8
9
10
11
// 注释一行用//
@misc{
author = "tt",
//month = "mar"
}
// 注释一个引用,去掉@
misc{
author = "tt",
month = "mar"
} -
避免因 url 过长而导致出现不必要的空格
在导言区加载
url宏包, 同时添加任意处可断1
2
3
4
5
6
7
8
9
10
11
12
13
14\usepackage{url}
\makeatletter
\def\UrlAlphabet{%
\do\a\do\b\do\c\do\d\do\e\do\f\do\g\do\h\do\i\do\j%
\do\k\do\l\do\m\do\n\do\o\do\p\do\q\do\r\do\s\do\t%
\do\u\do\v\do\w\do\x\do\y\do\z\do\A\do\B\do\C\do\D%
\do\E\do\F\do\G\do\H\do\I\do\J\do\K\do\L\do\M\do\N%
\do\O\do\P\do\Q\do\R\do\S\do\T\do\U\do\V\do\W\do\X%
\do\Y\do\Z}
\def\UrlDigits{\do\1\do\2\do\3\do\4\do\5\do\6\do\7\do\8\do\9\do\0}
\g@addto@macro{\UrlBreaks}{\UrlOrds}
\g@addto@macro{\UrlBreaks}{\UrlAlphabet}
\g@addto@macro{\UrlBreaks}{\UrlDigits}在
ref.bib中使用 \url 引用网址1
\url{http://www.example.com/very/long/url/that/might/cause/line/breaks}
-
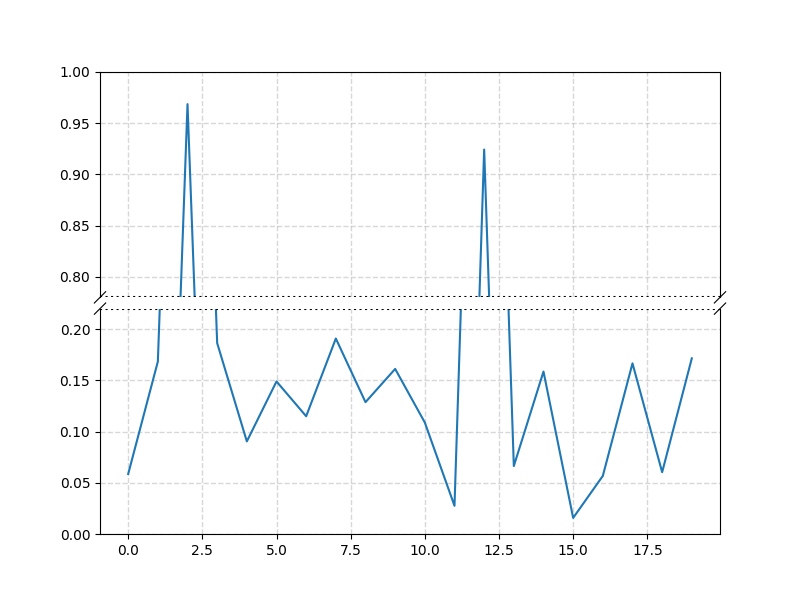
画带截断图
参考链接文章 https://zhuanlan.zhihu.com/p/588858165
1
2
3
4
5
6
7
8
9
10
11
12
13
14
15
16
17
18
19
20
21
22
23import numpy as np
import matplotlib.pyplot as plt
from brokenaxes import brokenaxes
np.random.seed(1289231)
# 设置20个随机点,且均不超过0.2
pts = np.random.rand(20)*.2
# 在2和12位置,设置两个离群点
pts[[2, 12]] += .8
fig = plt.figure(figsize=(8,6))
# 使用brokenaxes函数创建绘图坐标轴体系,ylim参数中输入断点两侧轴范围,
# despine参数控制是否显示上轴和右轴,hspace参数控制断点截断线之间的宽度,d控制断点截断线的长度
ax = brokenaxes(ylims=((0, 0.22), (0.78, 1.0)),despine=False, hspace=0.05, d=0.01)
ax.plot(pts)
# 设置网格线类型和透明度 & 加两条虚线
ax.grid(ls='--', alpha=0.5, linewidth=1)
ax.axhline(y=0.22, color='black', linestyle=':')
ax.axhline(y=0.78, color='black', linestyle=':')
plt.show()![]()